Solutions


Our Methodology :
- We leverage over a decade of experience in Military and Intelligence Community GEOINT support to provide IC ready unclassified analysis products that exceed ICD 203 standards and include insights cricital to GDMP customers
- We focus on using cost efficient sources of data to answer requirements by leveraging unique combinations of open-source and commercial data.
- We apply our decade of geospatial and data science workflows (AI/ML, cartographic production, data attribution, etc.) to extract and compile mission-critical data at the pace and quality only an elite GEOINT team could provide.
Our Partners :
Geo Owl has pre-arranged service and data agreements with cutting edge providers for commercial imagery, RF, OSINT, SIGINT, Commercial data and others to accelerate insights into unfolding events with flexible data sources, hands-on expertise, and streamlined delivery for better outcomes, value, and agility.

Gather
Requirements

Build or Innovate a Solution

Identify Critical Data Sources
Fuse Data into Products & Analysis

Deliver GEOINT Data and Products
NGA Standard GEOINT Products Structured Observations OSINT/GEOINT Fusion Products Change Detection Facility & Equipment Monitoring Crisis/Event Response Studies and Research
THE RIGHT TOOLS AND TECHNOLOGY :
We use the latest GEOINT Production hardware, software, methodologies to deliver fast and efficient services.
EXPERT GEOINT TEAM :
Our team consists of experts from across GEOINT and Technology disciplines, from Imagery and Geospatial Analysts to Cartographers and Data Experts. We deliver OPSEC safe, cutting edge GEOINT Data and Products.
IC STANDARDS :
Our team of GEOINT experts have decades of experience in intelligence community operations, we know how to deliver IC-ready products. We enrich your mission and the entire Intelligence Community by upholding strict analytic standards with ISO Certified Quality Processes included in all analytic products.
Synthetic Aperture Radar (SAR) Analysis Examples
Wide range of use cases
- Flood detection, deforestation monitoring, vessel detection, landslide monitoring
- Can collect data regardless of daylight and clouds
Our Recent Projects
- Deforestation monitoring in Brazilian Amazon
- Flood risk assessment in Brazil
- Illicit mining activity monitoring in Peru
- Non-Combatant Evacuation (NEO) data in Bolivia
- Vehicle Detection in Yemen
Example Project:
Monitoring Seasonal Flooding in South America
Open-source SAR imagery from Sentinel-1 was used to determine seasonal flood extent in an area of South America. For this project we performed change detection to highlight areas of new water in blue.

DRY SEASON

WET SEASON
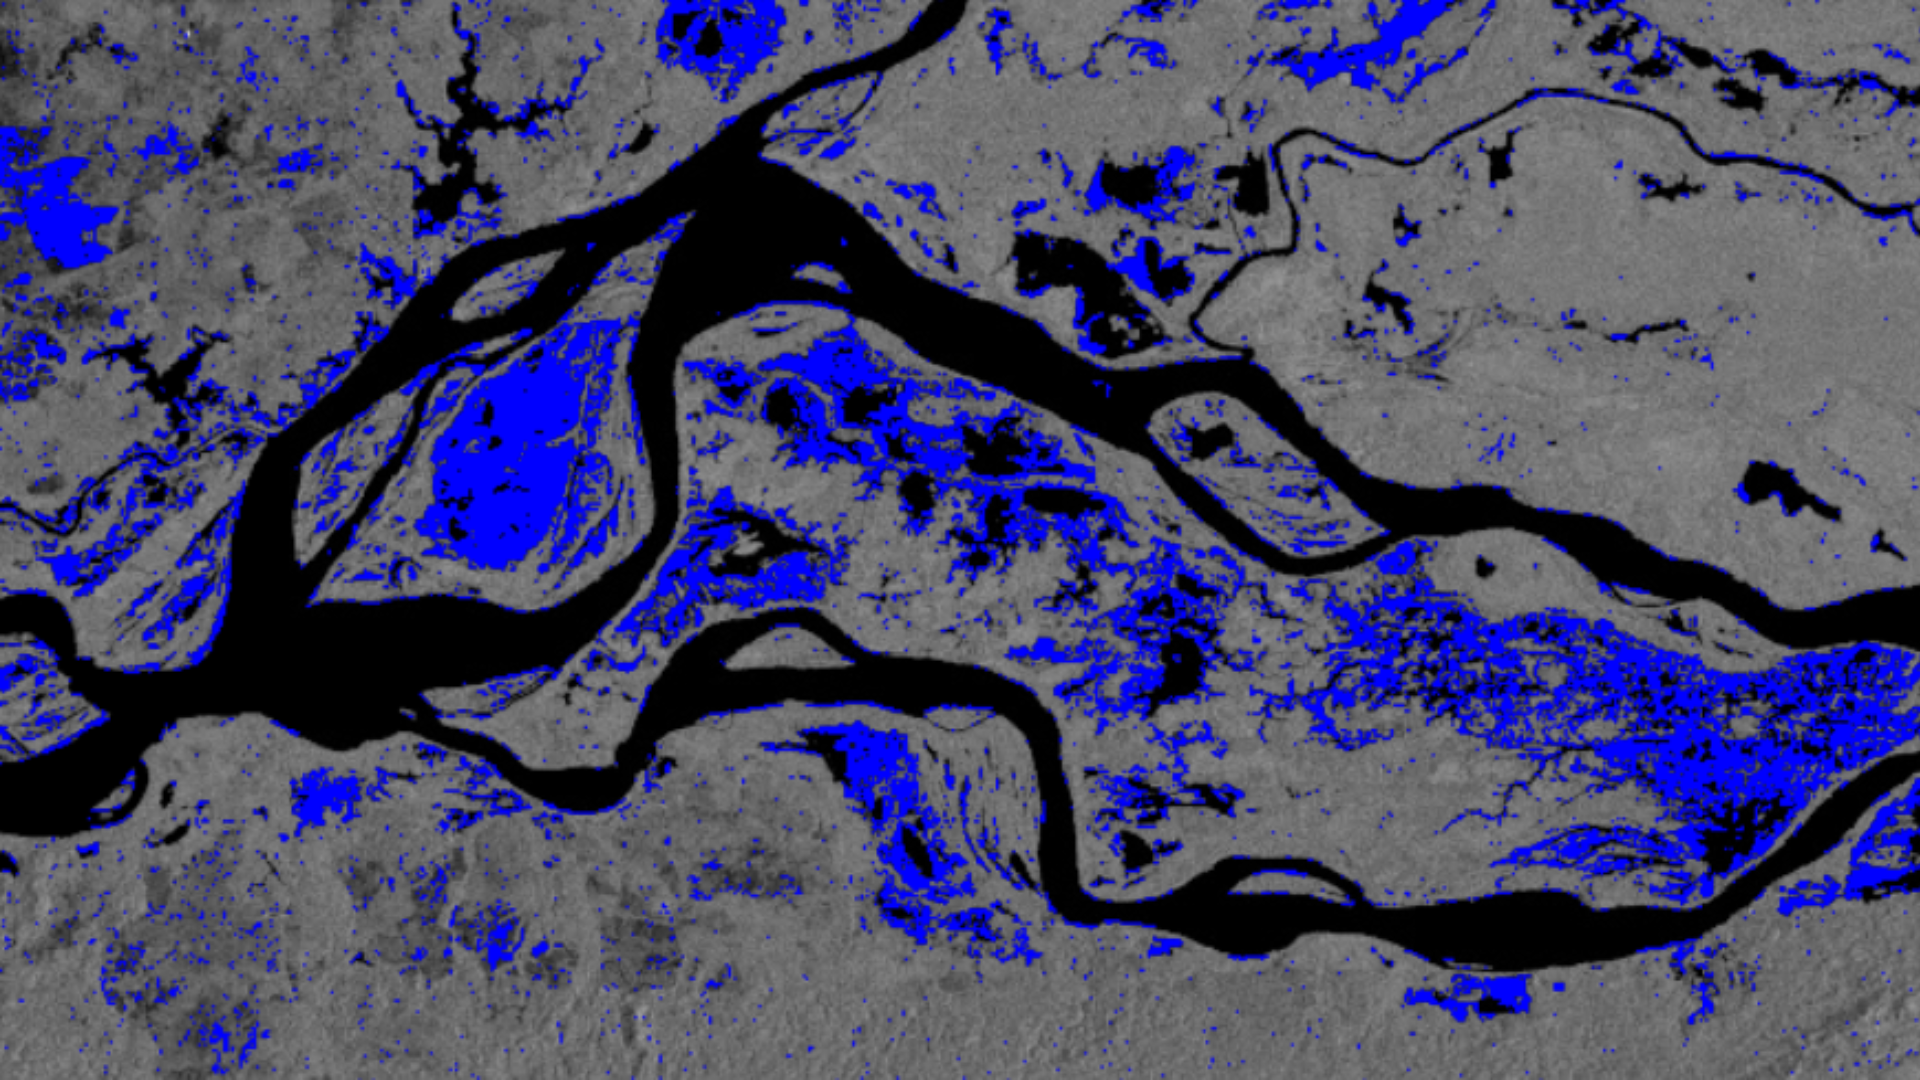
SEASONAL FLOODING CHANGE

SEASONAL FLOODING CHANGE
Use Case:
Non-Combatant Evacuation (NEO) in Bolivia
GOAL
Goal: determine optimal helicopter landing zones, details on critical buildings (hospitals, embassies, schools), and directions to nearest airport in support of evacuation efforts.
CONSTRAINT
Rapid turnaround (6 hours) for 8 areas of interest
DATA TYPES
Commercial SAR, open-source street view data, social media data, base maps
RESULTS
- Compilation of critical infrastructure, entry points, and reference photos
- Optimal routing to guide evacuation

CRITICAL INFRASTRUCTURE
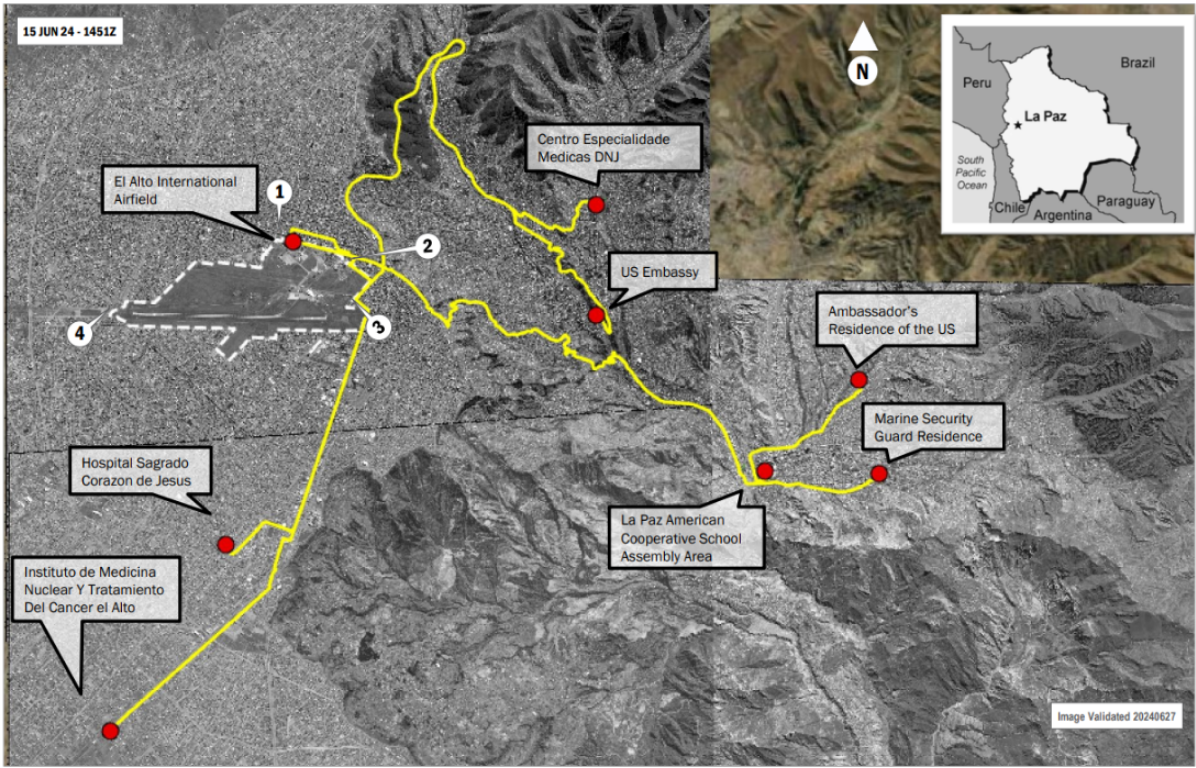
OPTIMAL ROUTING
SAR + EO Use Case:
Vehicle Detection in Yemen
GOAL
- Identify traffic patterns across 8 areas of interest for given time series.
- Identify possible civilian or military vehicles in the area.
DATA TYPES
- Commercial SAR, open-source electro- optical imagery (EO)
- Includes digitization of roads, buildings, confirmed vehicles, and potential vehicles, along with analyst notes
- Primarily based on human interpretation of SAR and EO imagery
SAR Use Case:
Deforestation in the Amazon Rainforest - Brazil
GOAL
Identify and quantify forest loss and growth throughout sections of the Amazon Rainforest from October 2021 – September 2023
DATA TYPES
- Open-source SAR
- SAR data derivatives (e.g. Radar Vegetation Index)
- Open-source elevation products
- Global forest change data
- Annual water classification data

Forest Loss: Red
Forest Gain: Blue
Areas of Interest: Blue and Purple Boxes
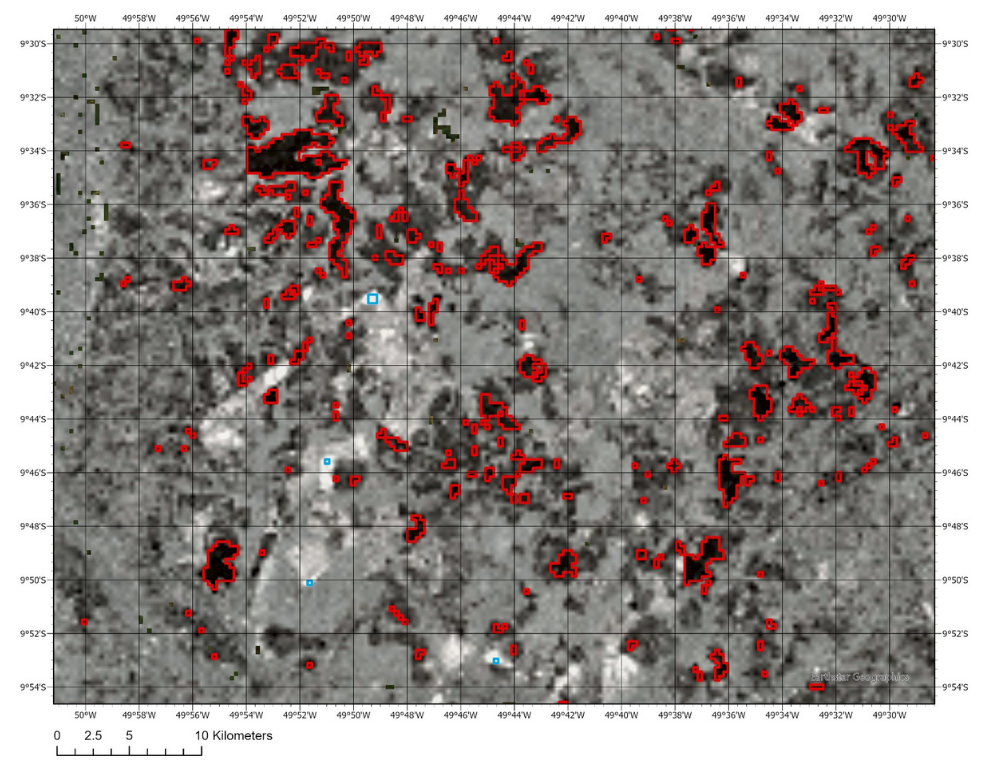
PRODUCT EXAMPLE
Forest change detection from wet to dry season.
Loss outlined in Red
Gain outlined in Blue
Total Loss = 164,081 acres
Total Gain = 15,491 acres
SAR + EO Use Case:
Flood Risk Assessment in Brazil
GOAL
Identify areas of potential flooding and associated critical infrastructure in a region of Brazil experiencing extended
heavy rainfall.
CONSTRAINT: Rapid turnaround, 24 hrs
DATA TYPES
Open-source and commercial SAR, open-source electro- optical (EO) images
PROCESS
- EO imagery used to extract major roads, bridges, and critical buildings (roads, bridges, hospitals, emergency response, etc).
- SAR change detection was performed to highlight areas of potential flooding (shown as yellow, orange, and red pixels).
- Performed for 4 areas of interest within 24 hours
SAR + MSI Use Case:
Illicit Mining Activity in Peru
GOAL
Detect changes in mining activity that may be associated with illicit mining
DATA TYPES
- Open-source and commercial SAR
- SAR derivates
- Open-source multispectral images (MSI)
- MSI derivatives
- Geological data from the South American Commission for the Geological Map of the World
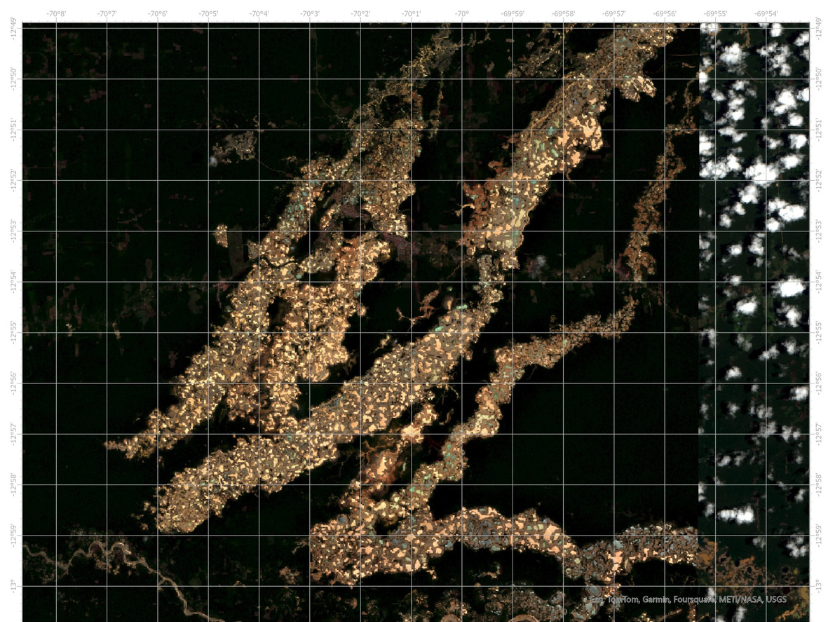
MSI OF A GOLD MINE
PROCESS
- Machine learning models were trained and run in Google Earth Engine to leverage cloud computing and script-based imagery queries.
- Semi-automated post processing to create final polygon predictions
- Polygons vetted and attributed by geospatial analysts to determine confidence rating and mining type
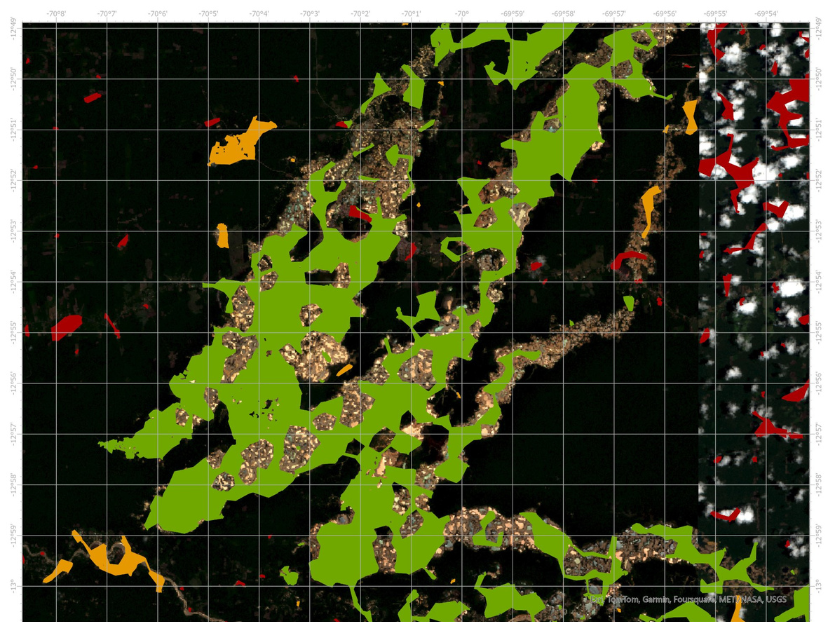
PREDICTION POLYGONS FOR AREAS OF MINING ACTIVITY CHANGE, COLORIZED BY CONFIDENCE RATING
SAR + MSI Use Case:
Illicit Runway Detection in Ecuador
GOAL
Detect illicit runways within Ecuador that meet suitability criteria for low slope, presence of deforestation, remoteness, and proximity to travel corridors including roads and waterways.
CONSTRAINT
- Open-source SAR
- SAR derivates
- Open-source multispectral images (MSI)
- Open-source near-real-time deforestation alerts
DATA TYPES
Deep learning models were trained and run in Google Earth Engine to leverage cloud computing and script-based imagery queries.
Model predictions were manually verified to assign confidence to predictions.
Airstrip locations were annotated in high-resolution imagery to create Operational Planning Products.
EO Use Case:
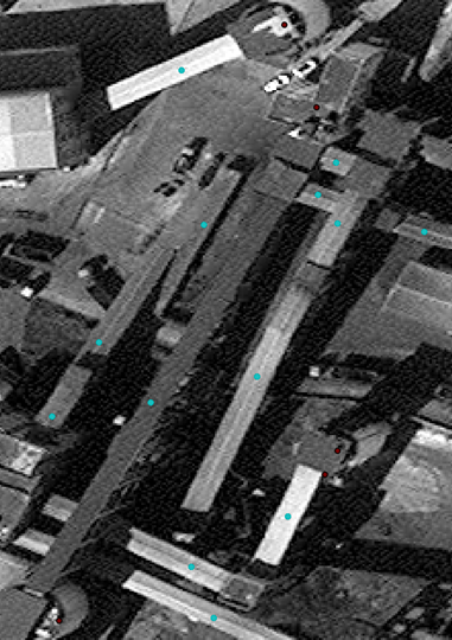
Monitoring Mining Activity in China
GOAL
Identify and provide structured observations of ground objects at coal mines in China to gain insights into the operational status of the mines and their role in the country’s energy security and carbon emissions.
DATA TYPES
- Open source and commercial Electro-Optical and panchromatic Imagery

CHINESE COAL MINE
PROCESS
- Acquire imagery to meet cadence requirements
- Create training data according to schema requirements and train computer vision model
- Develop automated and manual QA/QC protocol to address common errors
- Compile model predictions into custom site-specific GEOINT reports
Cartography Examples
Broad Support for All Project Types
- global, regional, national, and local scales
- services include data management, data production, and cartographic design
Our Recent Projects
- Topological Data Store Conditioning & Maintenance
- Topological Data Store Land Cover & Ground Cover Enrichment & Maintenance
- Administrative Boundaries
- Community Wall Map for Davis Shores, NC
- Wall Map for Billings Interagency Task Force
Cartography Use Case:
Topological Data Store Conditioning & Maintenance
GOAL
Digitize and attribute cartographic features at multiple scales for use in foundational intelligence products
DATA TYPES
- High resolution commercial Electro-optical (EO) imagery
- Topological Data Store (TDS) cartographic vector data
PROCESS
- New features are manually digitized at required scales, or rescaling is applied to existing features using automated, semi-automated, or manual methods
- Remove and correct errors in feature geometry or attribution
- Generate metadata and attribution according to Federal Geographic Data Committee (FGDC) standards
- Perform continuous quality control using manual or automated methods
Cartography Use Case:
Topological Data Store Land Cover & Ground Cover Data Enrichment & Maintenance
GOAL
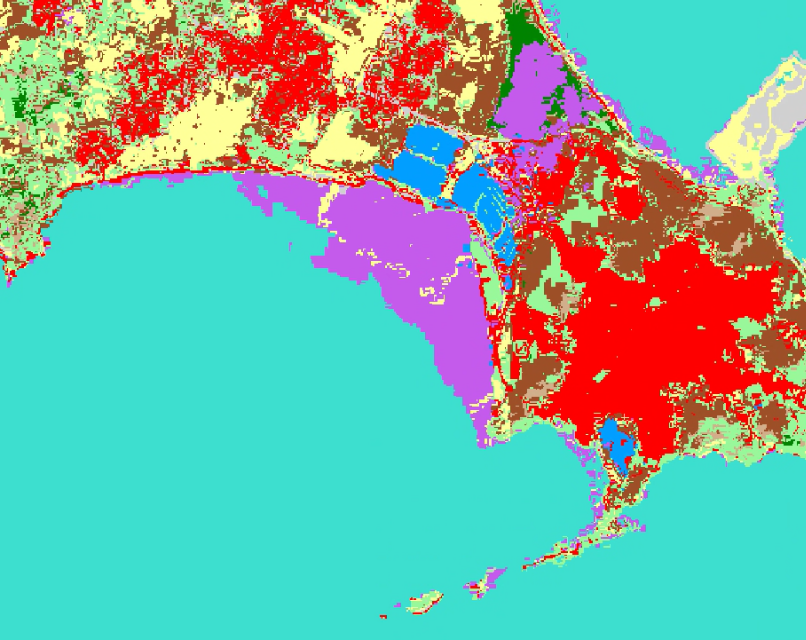
Classify land cover and ground cover types and identify land cover changes for use in foundational intelligence products
DATA TYPES
- Medium resolution open-source multispectral imagery (MSI)
- Topological Data Store (TDS) land cover vector data
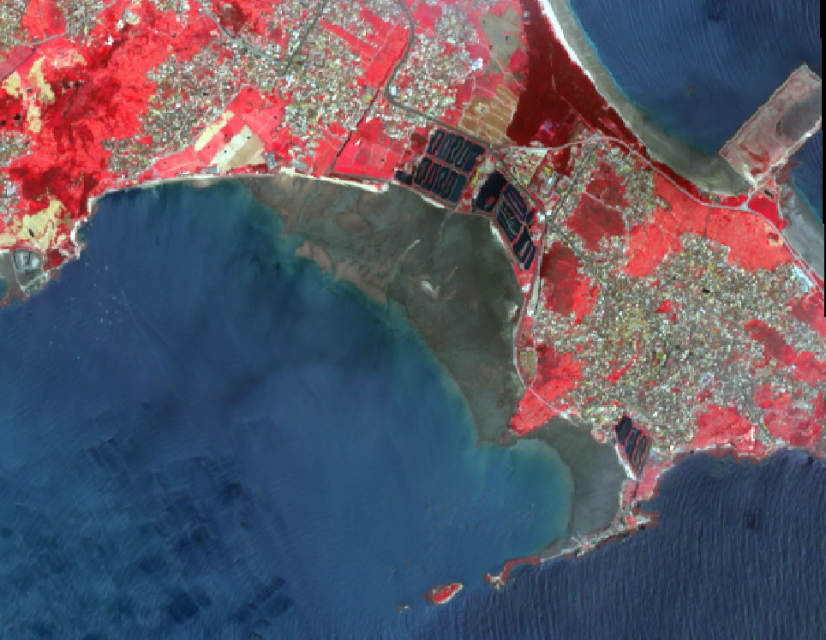
MSI HIGHLIGHTING URBAN
AREA (ABOVE)
FINAL CLASSIFICATION
(BELOW)
PROCESS
- Classify imagery using Erdas Imagine and ArcGIS Pro
- Assess changes in Erdas Imagine using overlays or imagery manipulation, including Radiometry and Discrete DRA adjustments
- Utilize Unsupervised Feature Extraction to update land use types
- Identify and correct errors between the imagery and classification using pixel remapping, edge matching, or additional methods
Cartography Use Case:
Administrative Boundaries
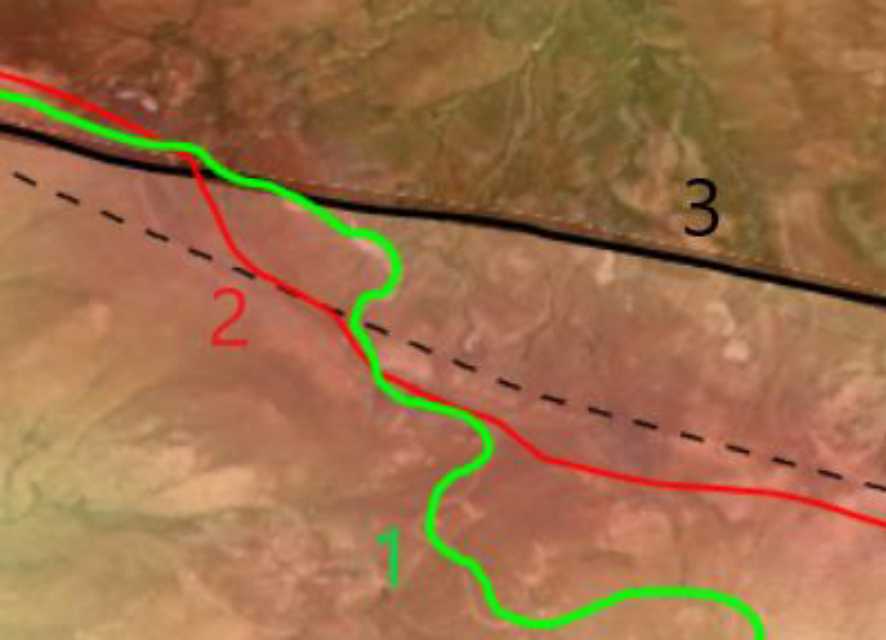
EXAMPLE OF REFERENCE DATA SOURCES USED TO DETERMINE BOUNDARIES
PROCESS
- Align ADM1 with the DWC and LSIB
- Extract ADM2 and ADM3 and align with LSIB
- Reference and translate source data and vertify conformance of boundaries with natural features including hyrdrology and ridgelines
- Perform manual editing techniques to ensure proper snapping of boundaries
Cartography Use Case:
Wildfire Response Wall Map for Billings Interagency Task Force
GOAL
Create large wall map (12×8 ft) to be used for wildfire response and planning by the Billings Interagency Task Force, a joint effort between the US Forest Service and Bureau of Land Management
DATA TYPES
- Recreation, Features of Interest, Trails, Roads, Hydrology, and Boundaries vector data from nine (9) civilian government agencies and other public sources
PROCESS
Utilize cartographic design principles to ensure all symbology and labels are easily interpreted
Leverage public datasets to symbolize 60 data layers using standard and custom symbology
Generate symbology template to enable future updates of map product
Coordinate across multiple stakeholders (USFS, BLM) to balance their priorities and preferences
Cartography Use Case:
Community Wall Map for Davis Shores, NC
GOAL
Create large educational display map of ultra-high resolution imagery and elevation in a coastal North Carolina Community
DATA TYPES
- Ultra-high resolution Electro-optical (EO) imagery from unmanned aerial system (UAS)
- Digital Elevation Model (DEM) derived from EO imagery using structure-from-motion (SfM)
- Contours derived from DEM
PROCESS
Photogrammetric processing of EO using Pix4Dmapper to generate orthoimagery and DEM
Contour generation using ArcGIS Pro
Application of cartographic design principals including scaling and layer order
Addition of graphic design elements including customized font and color matching
Environmental Analysis & Monitoring Examples
Support a variety of applications
- Invasive species monitoring, endangered species monitoring, environmental impact assessment, habitat change assessment, coastal monitoring
Our Recent Projects
- Phragmites Detection in Cape Hatteras National Seashore, NC
- Habitat change in Ocean Isle Beach, NC
- Coastal Change Assessment for Sea Island, GA
- Coastal Elevation Baseline for Debidue Beach, SC
- Cumulative Environmental Impact Assessment in St. Augustine, FL
- Red Cockaded Woodpecker Monitoring in NC
Example Project:
Red Cockaded Woodpecker (RCW) Monitoring in North Carolina
For this project, we assessed the feasibility of utilizing multispectral and thermal sensors on unmanned aerial systems for monitoring RCW populations.
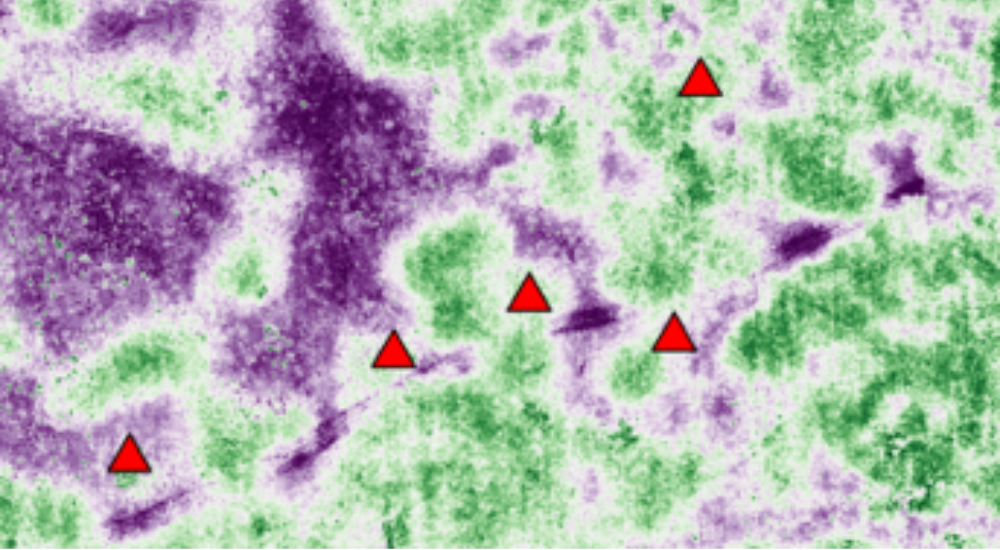
RCW NESTING SITE
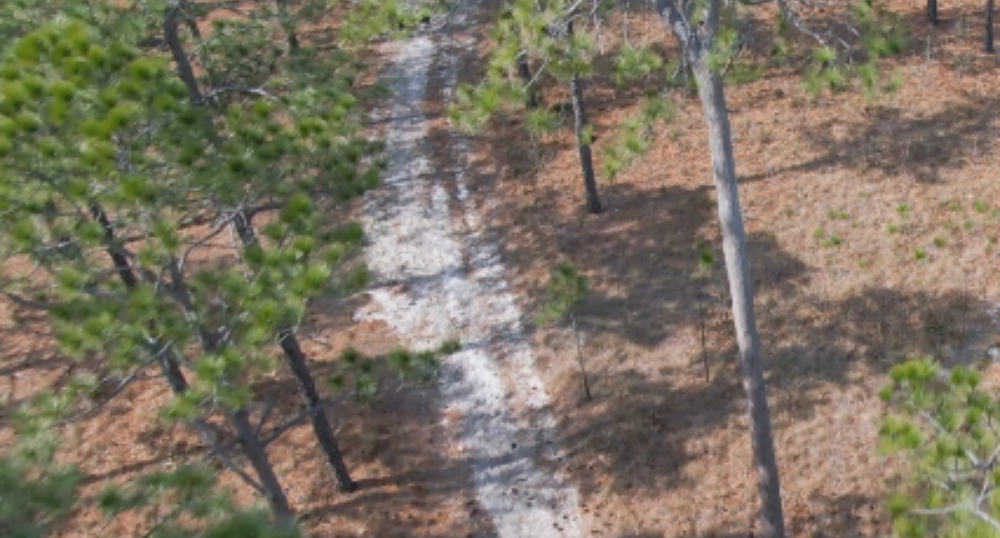
RCW CAVITY TREE

RCW CAVITY TREE
Invasive Species Use Case:
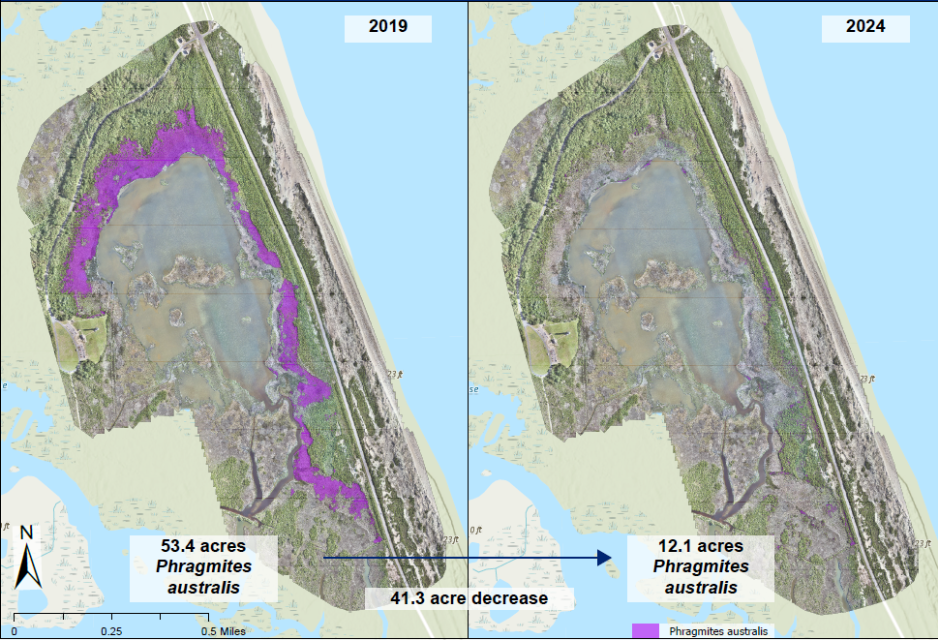
Phragmites Detection in Cape Hatteras National Seashore
GOAL
Quantify the extent of an invasive reed, Phragmites australis, in North Carolina and change from previous years
DATA TYPES
- Electro-optical (EO) imagery from unmanned aerial system (UAS)
- Multispectral images (MSI) from UAS
- EO+ MSI derivatives - digital elevation model (DEM) and spectral indices
- In-situ vegetation data for model training and verificaton
PROCESS
Machine learning models were trained and run in ArcGIS Pro using a pixel-based classification.
Model accuracy was assessed using a fractional cover method by comparing predictions to in-situ data
Change detection analysis quantified overall reduction or change in P. australis since mitigation began
Environmental Impact Use Case:
Cumulative Assessment for St. Augustine, FL
GOAL
Perform a cumulative Environmental Impact Assessment (EIA) for the Pellecier Creek & Matanzas River Basin near St. Augustine, FL

DATA TYPES
- Land Use/Land Cover (LULC) data from the South Florida Water Management District (SFWMD)
- Conservation Easement locations from SFWMD and St Johns County GIS Division
- Cumulative Impact Basin Data from SFWMD
- Florida Natural Areas Inventory (FNAI) data

PROCESS
Wetlands within the Basin were identified and classified as protected or at-risk
At-risk areas include private property with no easements or protective designations, and protected wetlands include those under public ownership, managed by public agencies, or under conservation easements
Protected vs at-risk wetlands were quantified by acreage
Extraction of wetland types relevant to the project area, including Mangrove Swamp and Saltwater Marsh
PROJECT RESULTS
There are 8,234 acres of Mangrove Swamp and Saltwater Marshes in Pellecier Creek & Matanzas River Basin.
At-risk = 2,650 acres
Protected = 5,584 acres
Coastal Monitoring Use Case:
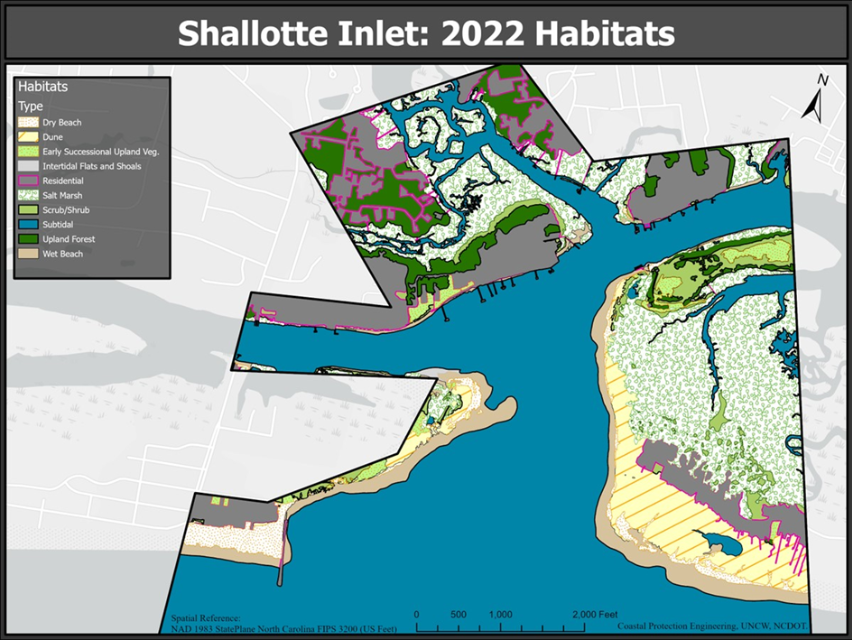
Coastal Habitat Assessment for Ocean Isle Beach, NC
GOAL
Determine habitat change following the construction of a terminal groin in Shallotte Inlet
DATA TYPES
- Electro-optical (EO) imagery from unmanned aerial system (UAS)
PROCESS
Digitize ten (10) habitat types from EO imagery
Calculate area for each habitat type and determine change from previous study
Create cartographic products which clearly represented the various habitats and changes
Coastal Monitoring Use Case:
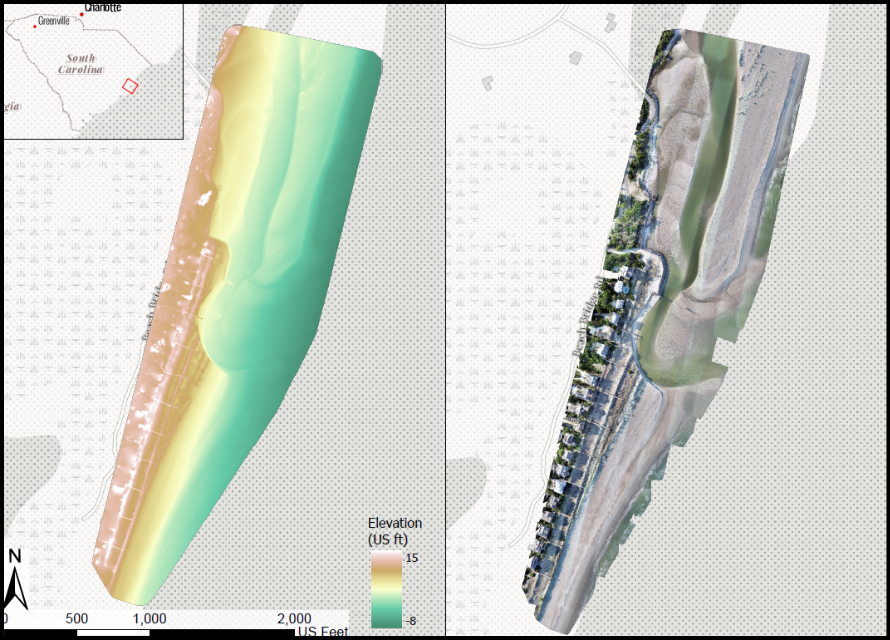
Coastal Elevation Baseline for Debidue Beach, SC
GOAL
Generate baseline imagery and elevation data for monitoring erosion from unidentified causes.
DATA TYPES
- Electro-optical (EO) imagery from unmanned aerial system (UAS)
PROCESS
Generate orthophoto and digital elevation model (DEM) from imagery
Extract 5 ft, 1 ft, and 0.5 ft contours from DEM
Create map products showing baseline imagery and elevation data
Coastal Monitoring Use Case:
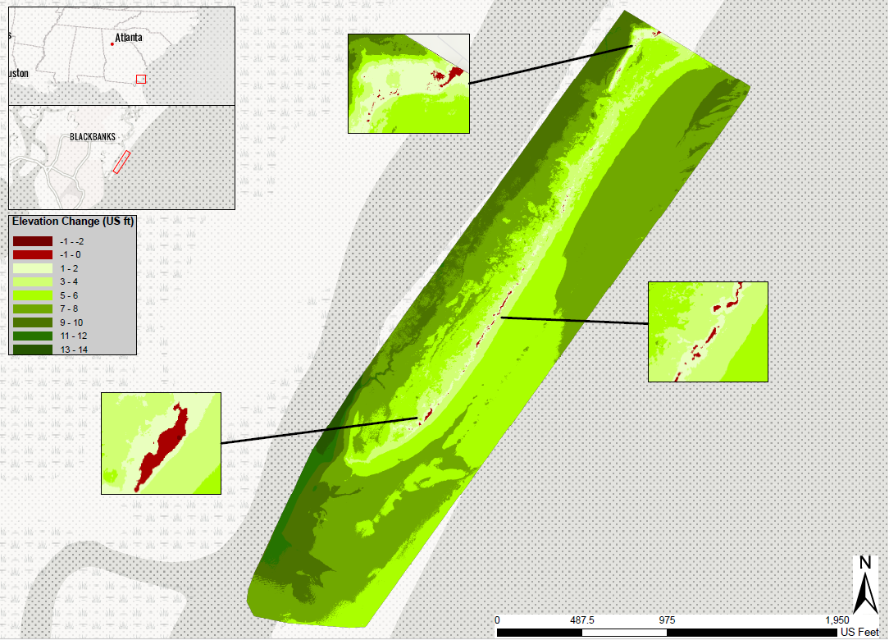
Coastal Elevation Change Detection for Sea Island, GA
GOAL
Generate annual imagery and elevation data for monitoring erosion caused by residential development.
DATA TYPES
- Electro-optical (EO) imagery from unmanned aerial system (UAS)
- Light Detection and Ranging (LiDAR) data from UAS
PROCESS
Generate orthophoto and digital elevation model (DEM) from imagery and LiDAR annually
Perform change detection between annual DEMs to determine erosion and accretion
Create map products showing annual imagery, annual elevation data and elevation change
Light Detection and Ranging (LiDAR) Processing Examples
Products and Analysis from Manned and Unmanned Systems
- Point Cloud Classification
- Quality Control
Our Recent Projects
- Indiana Department of Natural Resources
- US Forest Service AZ
LiDAR Processing Use Case:
Indiana Department of Natural Resources
GOAL
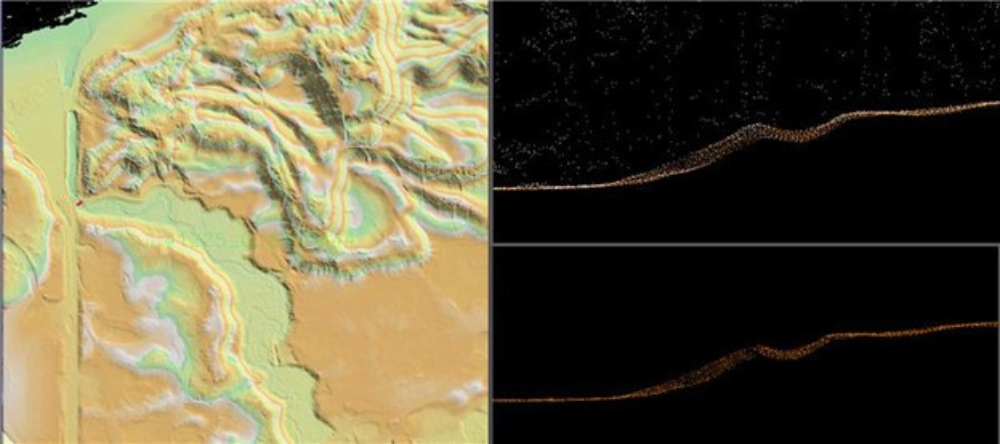
Perform basic ground edits so that the ground point cloud classification is clean of artifacts, pits, and voids.
DATA TYPES
- LiDAR from manned aircraft
- Google Earth Imagery/Google Street Maps for validation
PROCESS
Manually edit and reclassify erroneous point classifications using Microstation and TerraModeler for 100+ tiles within the 120 sq mi AOI
LiDAR Processing Use Case:
US Forest Service AZ
DATA TYPES
- LiDAR from manned aircraft
- Google Earth Imagery/Google Street Maps for validation
GOAL
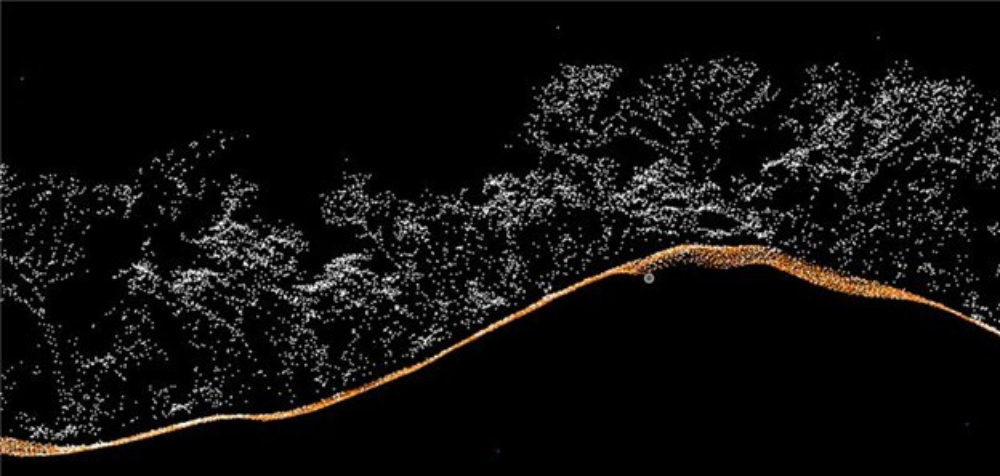
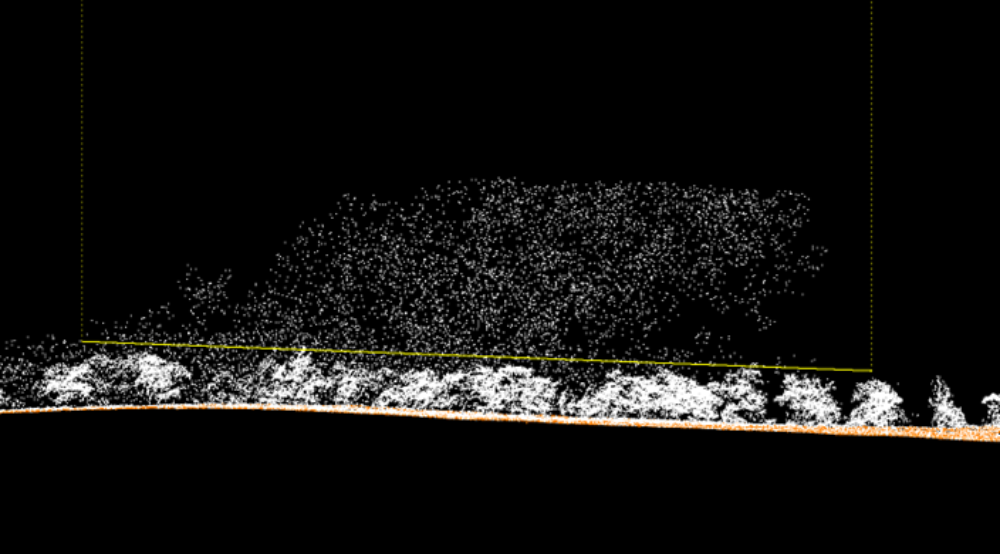
Identify and reclassify noise points within a ground point cloud.
PROCESS
Use Maximum Surface Height Raster (MSHR) in Global Mapper to search for anomalies/noise.
Reclassify noise using Noise Macro, Line Tool, Classify Isolated Points, and/or Brush Tool.
EXAMPLE POINT CLOUD NOISE
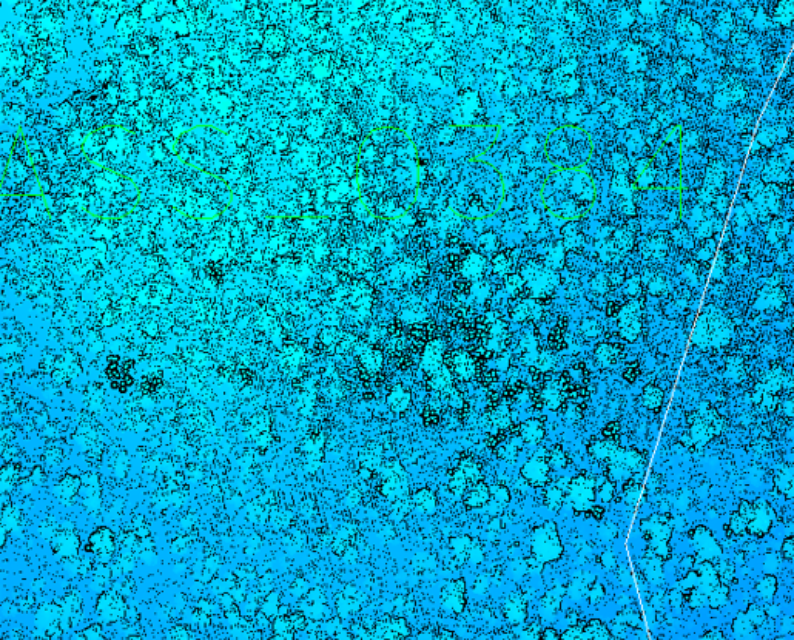
EXAMPLE POINT CLOUD NOISE
© 2024 Geo Owl. All rights reserved. Privacy Policy.
In order to perform some of the services offered, Geo Owl LLC affiliates with licensed professionals in certain jurisdictions.


